Date uploaded: 2022-06-17 16:22:00
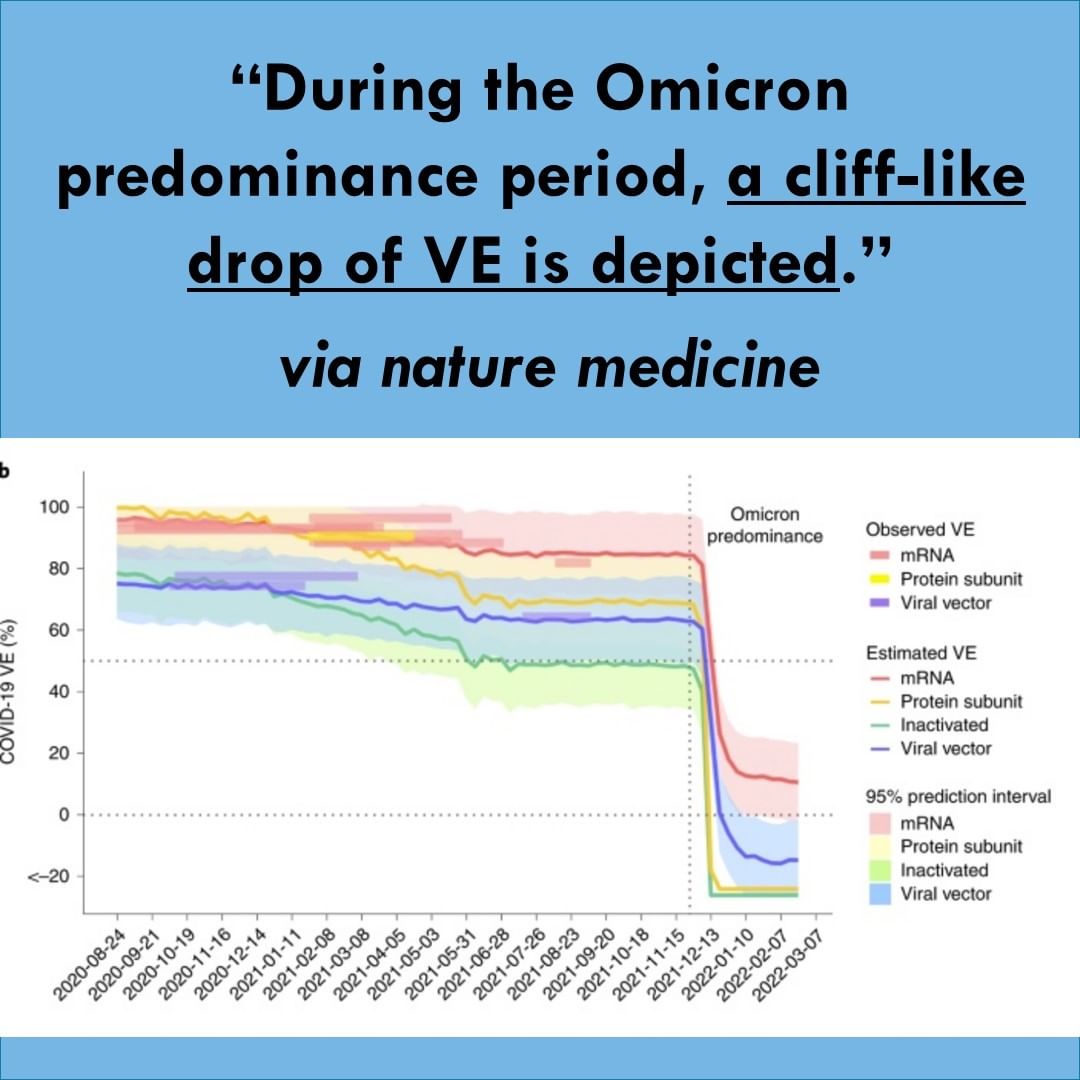
"VEs in California were estimated at weekly intervals for different xxxxxxx platforms. The surveyed VEs from clinical trials or observational studies during the same period are overlaid on the trend curve as colored rectangles for reference. The declining trend of estimated VE captures the influence of virus evolution on population-level immune protection. During the Omicron predominance period, a cliff-like drop of VE is depicted. The shaded areas are 95% prediction interval. The vertical dashed line marks the date of 26 November 2021, which is the earliest time of the Omicron appearance in these data. The top horizontal dashed line marks the 50% efficacy threshold."
https://tinyurl.com/ywm23y85
#efficacy #clifflikedrop #childrenshealthdefensepa #childrenshealthdefense
